| Regionalization at the PAL |
|
Authors: Raymond C. Smith
Scientific Basis for Regionalization at the PAL LTER Site
| Regionalization at the PAL |
|
|
The PAL study area is located to the west of the Antarctic Peninsula and centered on the region which surrounds Palmer Station (64deg 40'S, 64deg 03'W). Palmer Station (Fig. 1) is located in a protected harbor on the southwest side of Anvers Island midway down the Antarctic Peninsula. This study area is representative of a polar marine biome and research is focused on the Antarctic pelagic marine ecosystem, inclusive of marine sea ice habitats, regional oceanography and terrestrial nesting sites of sea bird predators.
The western Antarctic Peninsula (WAP) area is distinguished by a weather system that displays extreme seasonal and interannual variability. The Antarctic Peninsula is a physical barrier to tropospheric circulation which is reflected in the sharp contrasts between the relatively mild maritime climate to the west and north of the peninsula and the harsher more continental climate to the east and south. Further, the Peninsula is one place on the continent where the axis of the circumpolar low-pressure trough or atmospheric convergence line (ACL) crosses over land. The variability of the mean position of cyclones, as the ACL seasonally and interannually shifts along the Antarctic Peninsula, strongly influences winds, temperature and the distribution of sea ice. Weather patterns, balanced between contrasting influence of maritime as an continental climatic regimes, appear to reflect local amplifications of environmental change and hence may serve as an area for the early detection of trends elsewhere (Smith, Stammerjohn & Baker, 1996) . The marine ecology within this area is strongly coupled to the annual advance and retreat of sea ice, and the relatively large interannual variability in temperature and sea ice provides a study site where "natural" experiments can be conducted to investigate mechanisms linking physical forcing and ecosystem response under vastly different year-to-year climate conditions.
Marine ecosystems exhibit physical and biological variability over a wide range of space and time scales (Steele, 1978). This has led to developments utilizing contemporaneous buoy, ship, aircraft, and satellite sampling strategies (Fig. 2, Smith et al., 1987) in order to measure physical and biological distributions over large areas synoptically and over long time periods. Figure 2 compares the space/time domains of several physical and biological oceanic processes with space/time sampling regimes of various measurement platforms. The hatched areas show the excursion-generation times of some biological components, phytoplankton, zooplankton and fish. For the Antarctic marine ecosystem these space/time domains are roughly equivalent to those for phytoplankton, krill and higher predators. This simplified representation of space and time scales suggests the convolution of factors such as size distribution, number of species within each trophic grouping, life span, predator-prey interactions, etc. that influence spatial structure in marine systems. The stippled areas indicate space/time scales for selected physical forcings which also cover a wide range. Further, the intrinsic three-dimensional nature of water movement and processes make it difficult, if not impossible, to separate horizontal and vertical distributions or to obtain a "pure time series" of events in the sea. Multiplatform sampling strategies, making combined use of ships, buoys, aircraft, and satellites, are essential to increase the space/time coverage and provide the data and insight necessary for useful prediction across scales.
Spatial heterogeneity of organisms has long been recognized as an ecosystem attribute and the quantification of this heterogeneity as a function of scale has been used to judge the applicability of extrapolating small scale experiments to the larger scale natural environment and to provide information with respect to the biological and/or physical processes that generate observed patterns. For example, the spatial distribution of phytoplankton populations, as estimated using pigment biomass, is a central component in the biological dynamics (Legendre and Demers, 1984) of an aquatic ecosystem and has been used to: 1) characterize scales descriptively under different environmental conditions; 2) identify and account for the mechanisms responsible for and contributing to the space/time heterogeneity in populations; 3) understand the proximal determinants of phytoplankton growth and the linkages of this growth to higher trophic levels; 4) understand the significance of this heterogeneity in terms of the stability of the ecosystem; and 5) understand the fundamental variability of the ocean environment so as to increase the reliability of sampling.
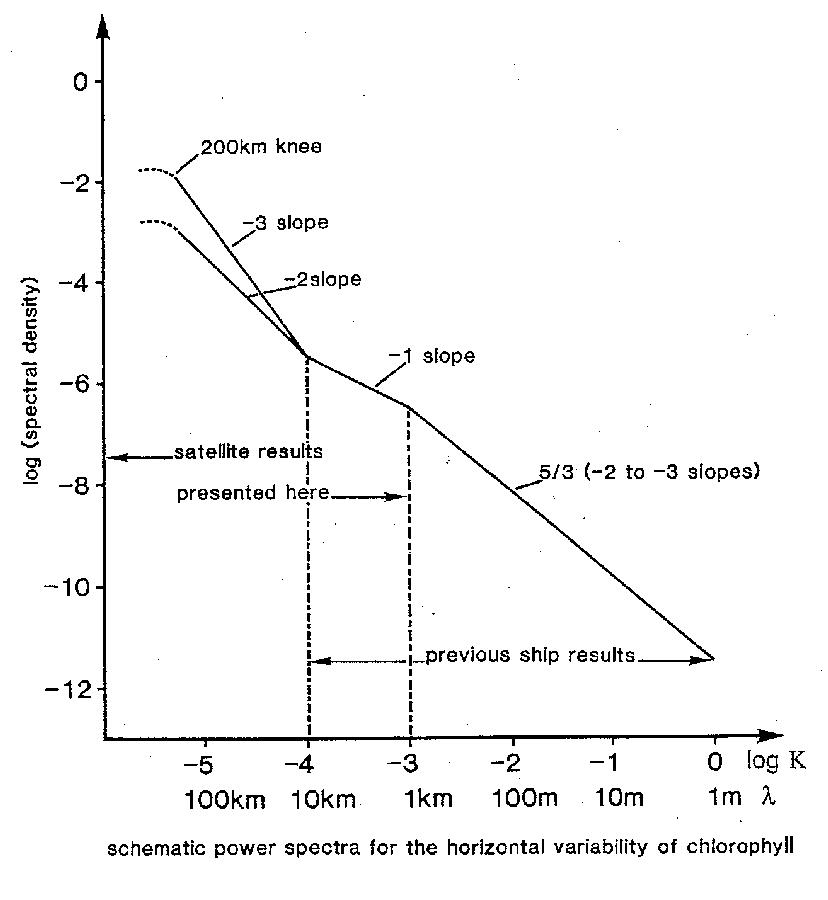
Spectral analysis (Platt, 1972) has played an important role in the statistical analysis and understanding of the spatial structure of phytoplankton populations, i.e. "patchiness". A "patchy" distribution is one for which the ratio of the variance to the mean is far greater than would be expected if individual organisms were positioned randomly within the sampled region. Several distinct physical regimes have been associated with the scales of variability of phytoplankton populations (Denman and Powell, 1984). At scales of less than 1 m (10^-3 to 1 m), molecular diffusion and viscosity of spatial gradients are strong enough that fluid motions can be considered isotropic. At scales larger than a few meters the density stratification of the ocean begins to inhibit vertical motion and both turbulence and periodic motions become increasingly horizontal. At length scales of the order of 10-20 km, in near shore environments, the rotation of the Earth begins to play a dominant role. At larger horizontal scales (10-100 km) the upper layer flow of the ocean is basically geostrophic and two-dimensional (Pond and Pickard, 1983).
Figure 3 (Smith et al., 1988) shows a schematic power spectra for the horizontal variability of chlorophyll which integrates the results from both ship and satellite observations. At spatial scales of less than 1 km both sea surface temperature (SST) and pigment biomass show similar spectral slopes where turbulence dominates, with a wave number dependence of -5/3. At wavelengths greater than 10 km, mesoscale phenomena with slopes of about -2 and geostrophic currents with slopes of about -3, predominate. At intermediate scales of between 1 and 10 km there is a region where biological processes dominate, with a spectral slope of about -1. These experimental results using satellite imagery and shipboard observations are in agreement with theoretical analysis (Lewis and Platt, 1982) and show that the characteristic length scales are determined by the relative importance of the scales of physical forcing to the biological reaction scales. The transition regions in a spectral density plot, delimiting domains of spatial variance (1 and 10 km in Fig. 3), will shift to longer spatial scales with both slower growth and higher grazing pressure (as might be expected in the Antarctic marine system). In contrast to "passive" phytoplankton, the spatial variance of mobile organisms (e.g., krill) display a much flatter spectra, where the spatial variance is less at large scales and greater at small scales than that for surface temperature or phytoplankton (Weber et al., 1986; Levine et al., 1989). It has been suggested (Horne, 1994) that mobility and schooling are capable of generating the higher small scale spatial variance. These results show that when considering spatial scales in marine ecology, time and space scales are interconnected, i.e., when spatial scales are under investigation the dominant time scales of both physical forcing and biological processes must also be considered (Levin, 1989).
Regional Estimate of Phytoplankton Production
As a specific example of "regionalization" as applied to a marine ecosystem we consider the estimation of phytoplankton productivity for the Southern Ocean. Our sampling strategy combines seasonal time series data from a fine-scale grid near Palmer Station, data collected from research cruises which cover a large-scale grid along the Antarctic Peninsula (Fig. 1) and use of satellite data. The grids provide a means of integrating spatial data acquired at different scales and times, and in different formats (Waters and Smith, 1992). We assume that domains of spatial variance, comprised of regions within which results can be safely extrapolated across scales, can be associated with hydrographic and biogeochemical sub-divisions of the Antarctic marine ecosystem.
Treguer and Jacques (1992) have identified four major functional sub-divisions in terms of the mechanisms of nutrient dynamics which control phytoplankton production and which are delineated by major frontal systems: (1) a highly productive Coastal and Continental Shelf Zone (CCSZ), (2) a relatively productive Seasonal Ice Zone (SIZ), (3) a less productive Permanently Open Ocean Zone (POOZ), and (4) a Polar Front Zone (PFZ). The PAL area west of the Antarctic Peninsula is a complex combination of two of these distinctive sub-divisions, the CCSZ which is swept by the SIZ. It is a region where factors giving rise to highly productive nearshore blooms are modified and modulated by the annual advance and retreat of sea ice. A variety of factors control phytoplankton growth (light, temperature, nutrients) and accumulation (water column stability, grazing, and sinking) in this complex environment, and it is unlikely that any single factor dominates. Here we draw upon recent PAL data, historical data, both surface (Smith et al., 1996a) and satellite (Sullivan et al., 1993), to estimate the net primary productivity (NPP) for the PAL region and the Southern Ocean as a whole.
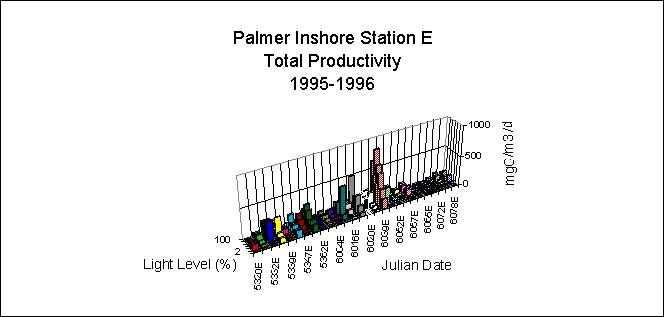
Figure 4 presents a time-series of primary production as a function of percent light level within the water column (Vernet et al., 1995) over a growth season at a station within the CCSZ . These data reveal three distinct bloom events and provide sufficient temporal resolution to permit the large-scale cruise data to be placed into a seasonal and interannual context. Yearly production, from 15 November 1994 through 15 March 1995, was 118 gC m^-2 y^-1. Selected productivity data for the Southern Ocean in terms of major functional units are presented in Table 1 (Smith et al., 1996b) where we emphasize historical data within the PAL region and only consider areas south of the Polar Front (i.e., we exclude the PFZ). The data show a considerable range of variability for each zone but allow first order estimates of productivity for the PAL area and, more tentatively, for the area of the Southern Ocean south of the Polar Front (roughly 32 x 10^6 km). Table 2, which is far from inclusive, lists several estimates of total annual production for the Southern Ocean including as estimate made using Coastal Zone Color Scanner satellite data (Smith et al., 1996b). Estimates vary by an order of magnitude and illustrate that global numbers meed to be considered cautiously.
In summary, key issues to be considered in making regional and global estimates for aquatic systems are: the space/time variability of the environment which requires multiplatform sampling strategies, the need to establish domains of spatial variance within which results can be reliably extrapolated across scales, and recognition of the necessary compromises made in sampling this environment and the corresponding assumptions used to extrapolate limited data over space and time.
1. JH Steele, ed., Spatial Pattern in Plankton Communities, Plenum Press, New York, 1978.
2. KL Denman and T.M. Powell, "Effects of physical processes on planktonic ecosystems in the coastal ocean," Oceanogr. Mar. Biol. Ann. Rev., 22:125-168, 1984.
3. Joel W Hedgpeth, "The Antarctic Marine Ecosystem," in: Adaptations within Antarctic Ecosystems: Proceedings of the Third SCAR Symposium on Antarctic Biology, George A Llano, ed., p. 3-10, Gulf Publishing, Houston, 1977. Sponsored by the Scientific Committee for Antarctic Research (SCAR) and the International Union of Biological Sciences and held under the auspices of the United States National Academy of Sciences. Washington, D.C..
4. JK Horne, "Spatial variance of Capelin (Mallotus villosus) in coastal Newfondland waters," J. Northw. Atl. Fish Sci., 17:33-43, 1994.
5. L Legendre and S Demers, "Towards dynamic biological oceanography and limnology," Can J Fish Aquat Sci, 41:2-19, 1984.
6. SA Levin, A Morin, and TM Powell, Patterns and processes in the distribution and dynamics of Antarctic krill, p. 281-299, 1989. SC-CAMLR-SSP/5 (Scientific Committee for the Conservation of Antarctic Marine Living Resources, Selected Scientific Papers Part 1, 1988): (SC-CAMLR-VII/BG/20.
7. SA Levin, "Physical and biological scales, and the modeling of predator-prey interaction in large marine ecosystems," in: Large marine ecosystems: patterns, processes and yields, K Sherman and LM Alexander, eds., p. xx-xx, American Association for the Advancement of Science, Washington, D.C., 1990.
8. MR Lewis and T. Platt, "Scales of variability in estuarine ecosystems," Estuarine Comparisons, p. 3-20, 1982.
9. JR Petit, JWC White, NW Young, J Jouzel, and YS Korotkevich, "Deuterium excess in recent Antarctic snow," Journal of Geophysical Research, 96(D3):5113- 5122, 1991.
10. Trevor Platt, Local phytoplankton abundance and turbulence, vol. 19. p. 183-187, Pergamon press, 1972.
11. S Pond and G Pickard, Introductory Dynamical Oceanography, Pergamon Press, New York, 1983. (329 pages).
12. Raymond C Smith, O B Brown, F E Hoge, Karen S Baker, R H Evans, R N Swift, and W E Esaias, "Multiplatform sampling (ship, aircraft, and satellite) of a Gulf Stream warm core ring," Applied Optics, 26(11):2068- 2081, 1987.
13. Raymond C Smith, Xueyun Zhang, and Joel Michaelsen, "Variability of pigment biomass in the California Current system as determined by satellite imagery. Part I: Spatial variability," Journal of Geophysical Research, 93(D9):10,863-10,882, 1988.
14. Raymond C Smith, H Dierssen, and Maria Vernet, "Phytoplankton biomass and productivity to the west of the Antarctic peninsula," in: Foundations for Ecological Research West of the Antarctic Peninsula, RM Ross, EE Hofmann, and LB Quetin, eds., vol. 70. (AGU Antarctic Research Series), 1996.
15. Raymond C Smith, Karen S Baker, ML Byers, and SE Stammerjohn, "Primary Productivity of the Palmer Long Term Ecological Research Area and the Southern Ocean (in press)," Journal of Marine Systems, 1996.
16. Raymond C Smith, Sharon Stammerjohn, and Karen S Baker, "Surface air temperature variations in the western Antarctic peninsula region," in: Foundations for Ecological Research West of the Antarctic Peninsula, RM Ross, EE Hofmann, and LB Quetin, eds., vol. 70. (AGU Antarctic Research Series), p. xx-xx, 1996.
17. CW Sullivan, KR Arrigo, CR McClain, JC Comiso, and J Firestone, "Distributions of phytoplankton blooms in the Southern Ocean," Science, 262:1832-1837, 1993.
18. P Treguer and G Jacques, "Dynamics of nutrients and phytoplankton, and fluxes of carbon, nitrogen and silicon in the Antarctic Ocean," Polar Biology, 12:149-162, 1992.
19. Maria Vernet, Wendy Kozlowski, and Ted Ruel, "Palmer LTER: Temporal and spatial variability in primary production in Arthur Harbor during the 1994/1995 growth season (in press)," Antarctic Journal of the United States, 1995.
20. Kirk J Waters and Raymond C Smith, "Palmer LTER: A sampling grid for the Palmer LTER program," Antarctic Journal of the United States, 27(5):236-239, 1992.
21. H Weber, S Z ElSayed, and I Hampton, "The variance spectra of phytoplankton, krill and water temperature in the Antarctic Ocean south of Africa," Deep-Sea Research, 33:1327-1343, 1986.